vega-lite-linter
A smart visual designer for automatic diagnosis and improving your design of visualization charts written in Vega-Lite.
iDVx Lab
Welcome to vega-lite-linter
Despite the growing popularity of data visualization, users may create imperfect visualizations with chart construction errors, for example, applying the wrong type of data field with the encoding channel.
Vega-lite-linter is a package to help users detect flaws and rectify already-built but defective visualizations.
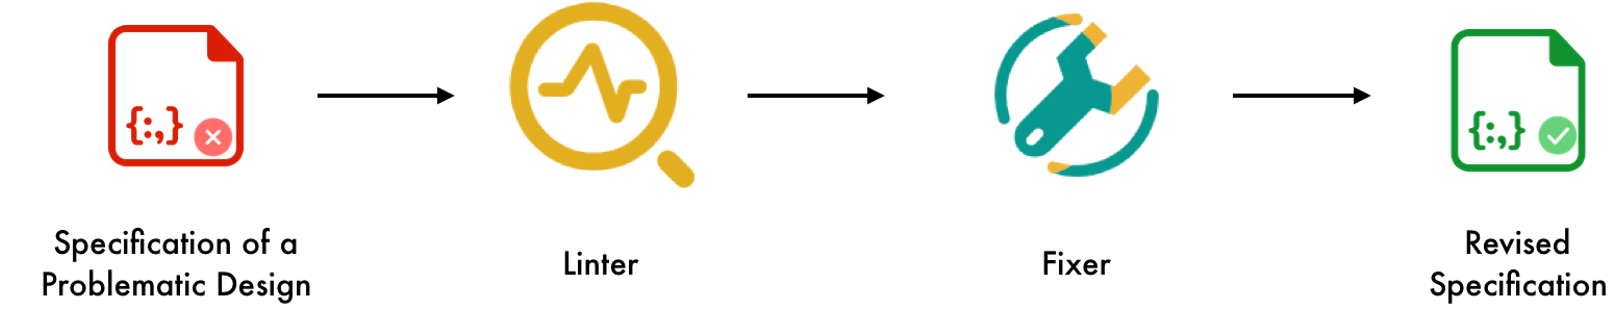
As shown in the above figure, the package consists of two components:
(1) a visualization linter, which applies well-recognized principles to inspect the legitimacy of rendered visualizations, and
(2) a visualization fixer, which automatically corrects the detected violations according to the linter.
Given a visualization specification written in Vega-Lite, vega-lite-linter can automatically detect design problems and provide revision suggestions for the visualization.
Vega-lite-linter was developed in Python 3 by the iDVx Lab.
AntV adapted it into its visualization library written in Javascript and integrated it into its internal BI tool.
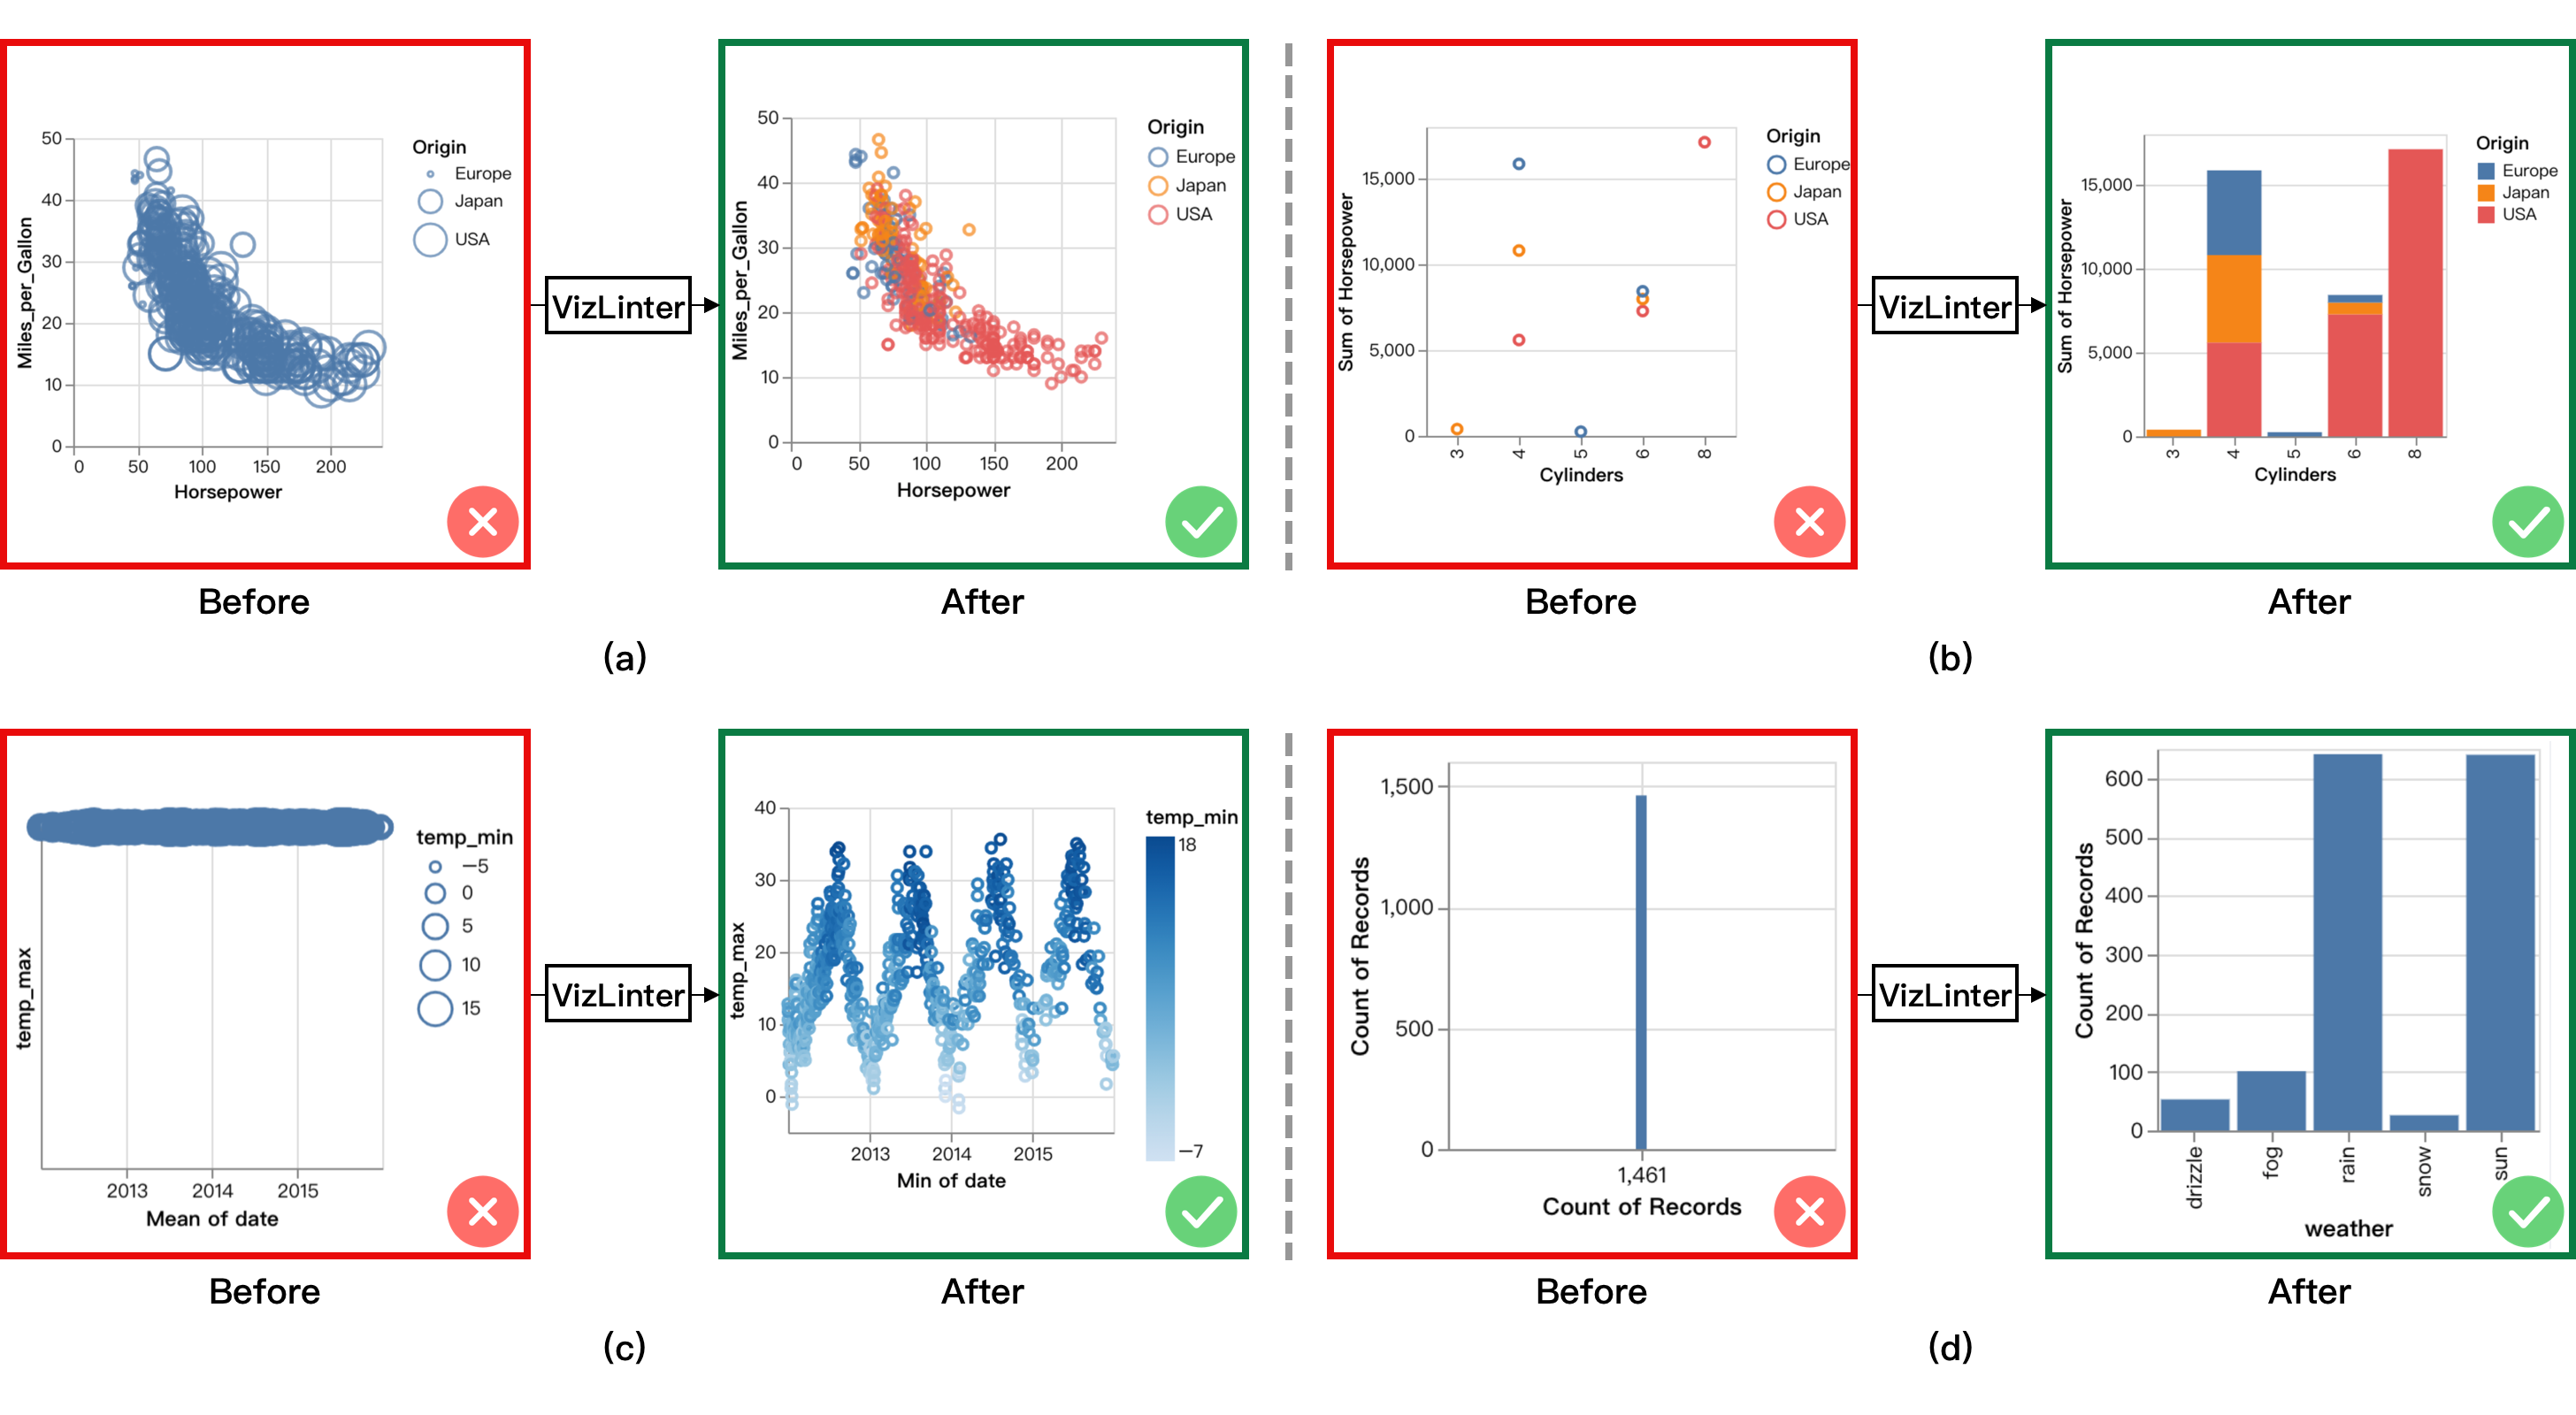
Here are four example cases of vega-lite-linter with the online editor VizLinter. In each case, the chart on the left is the original visualization with errors, and the chart on the right is the one modified by vega-lite-linter. Details are in Examples.
Video Overview
Try Online
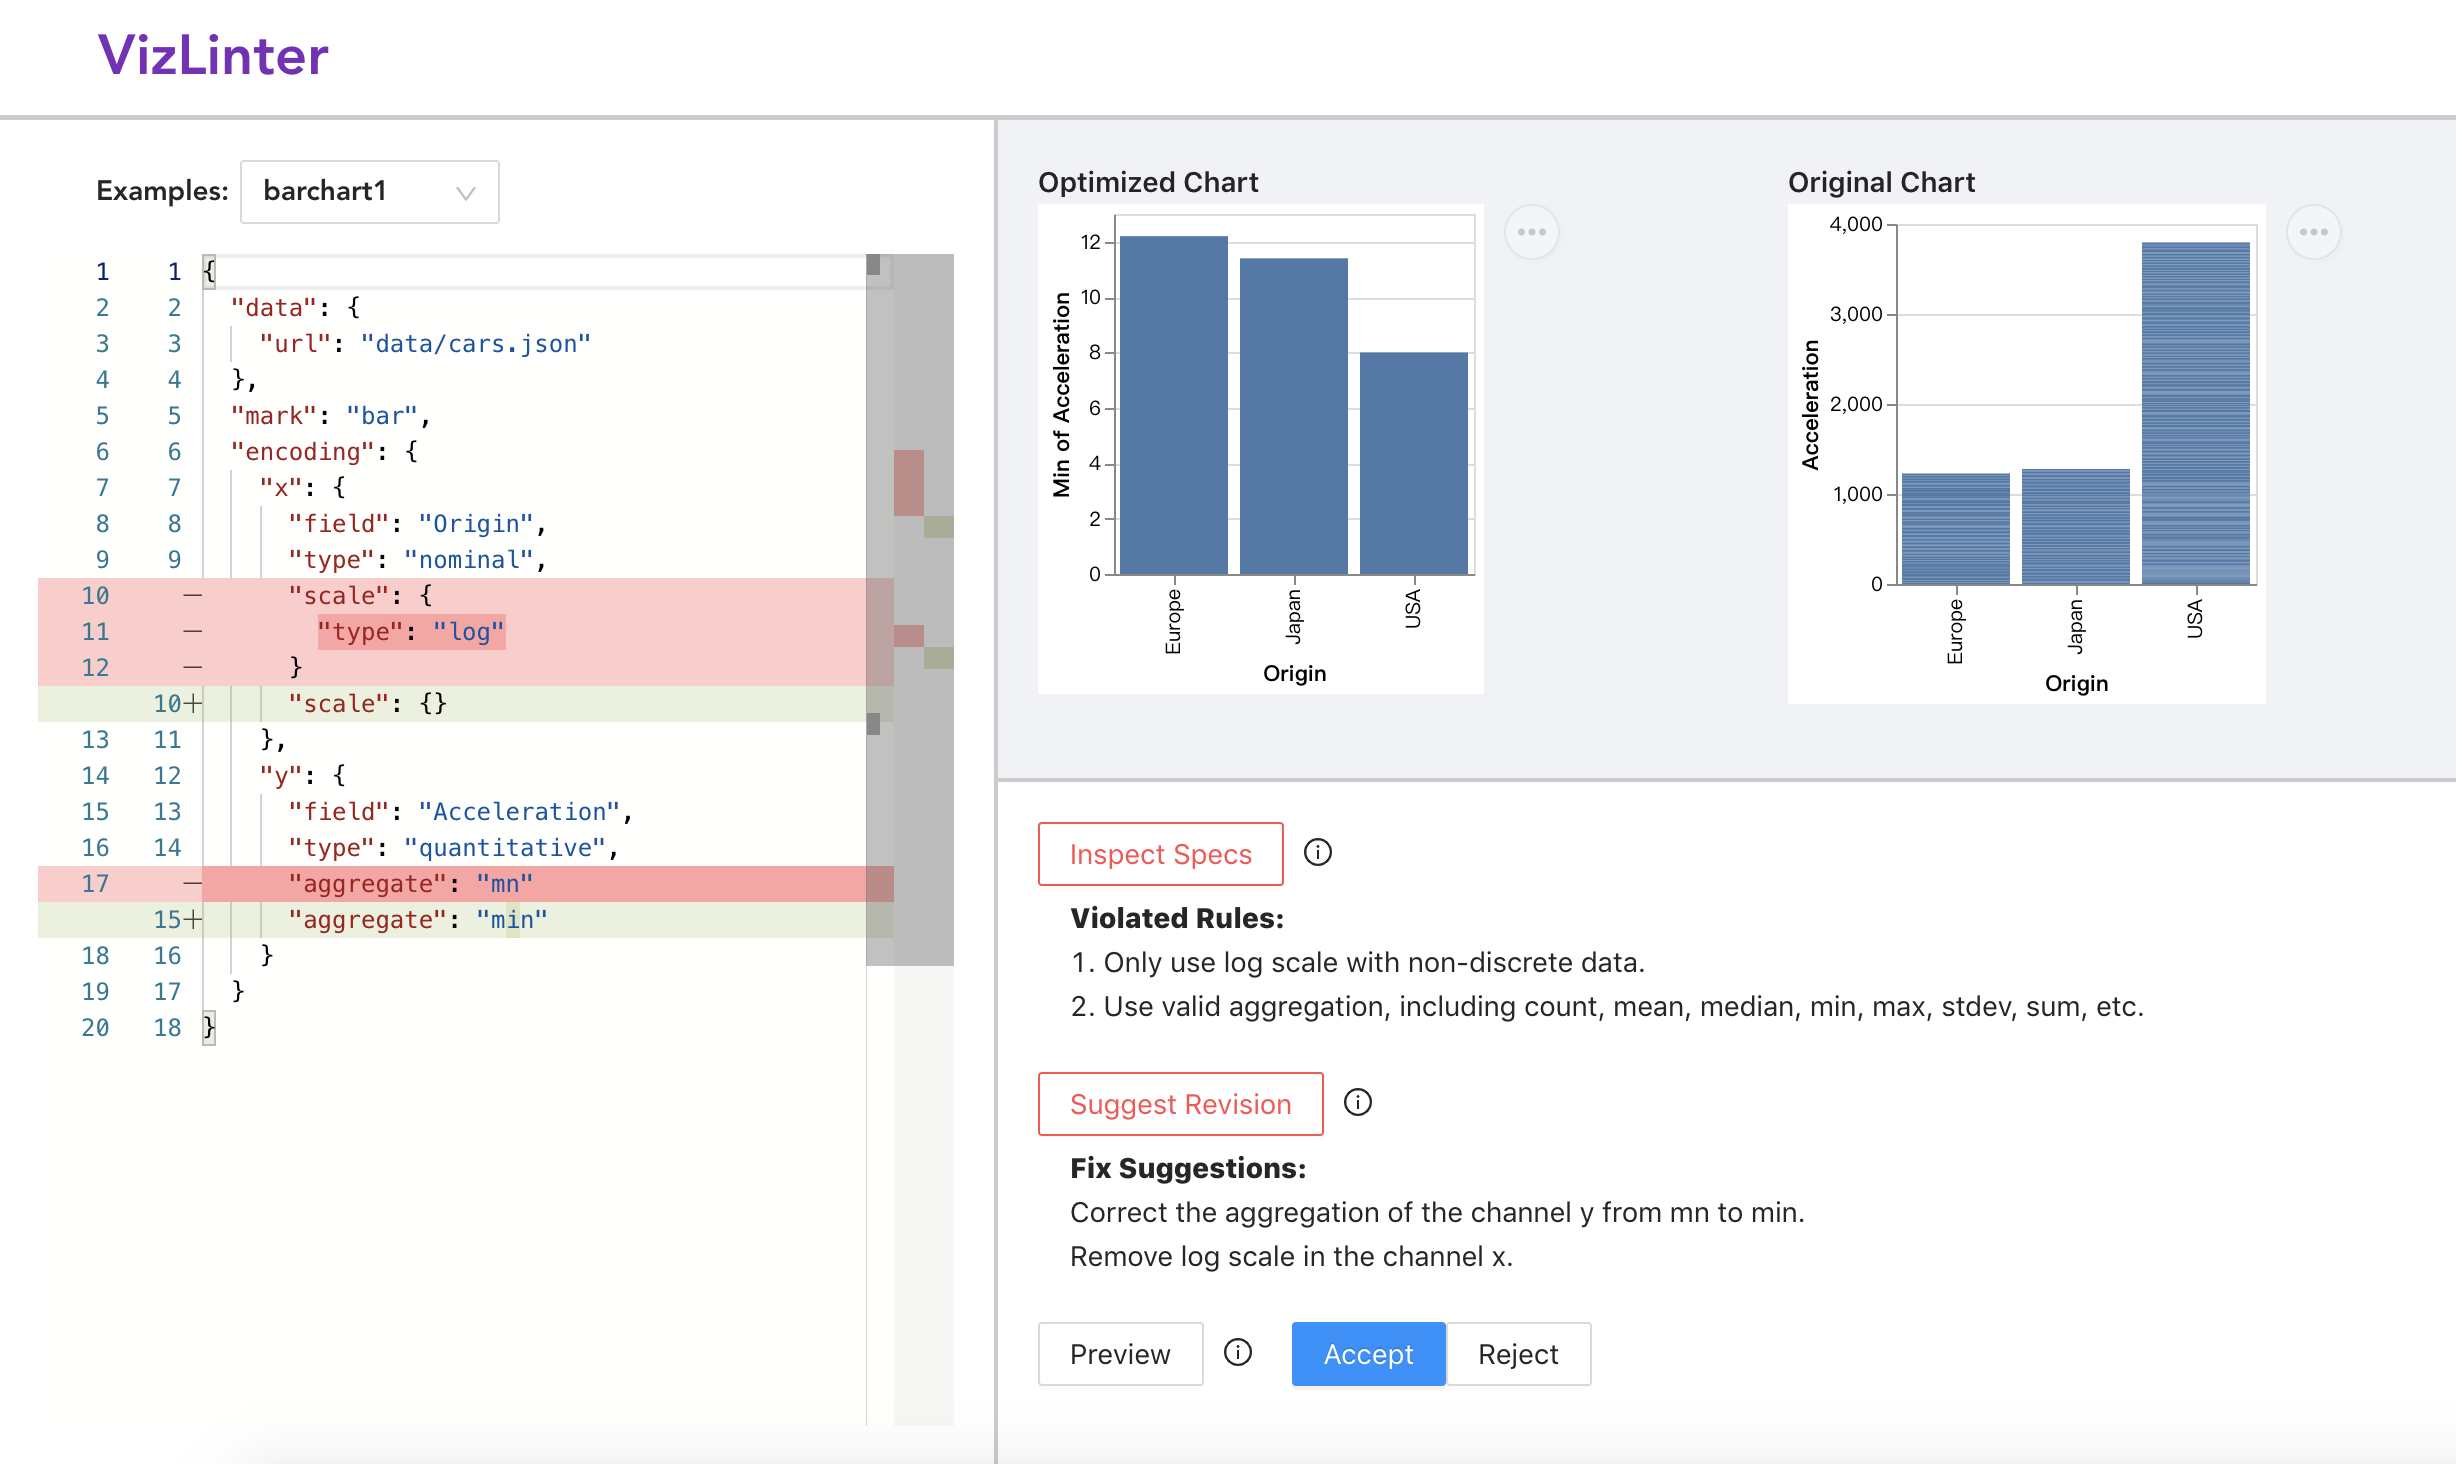
An online Vega-Lite editor VizLinter is developed with the linting and fixing functions based on vega-lite-linter for Vega-Lite developers to create and validate visualizations.
Credits
Vega-lite-linter was invented by the iDVx Lab together with AntV. Based on our technology, AntV and iDVx Lab also developed ChartLinter in Javascript to support visualization charts beyond Vega-Lite.