Examples
Application
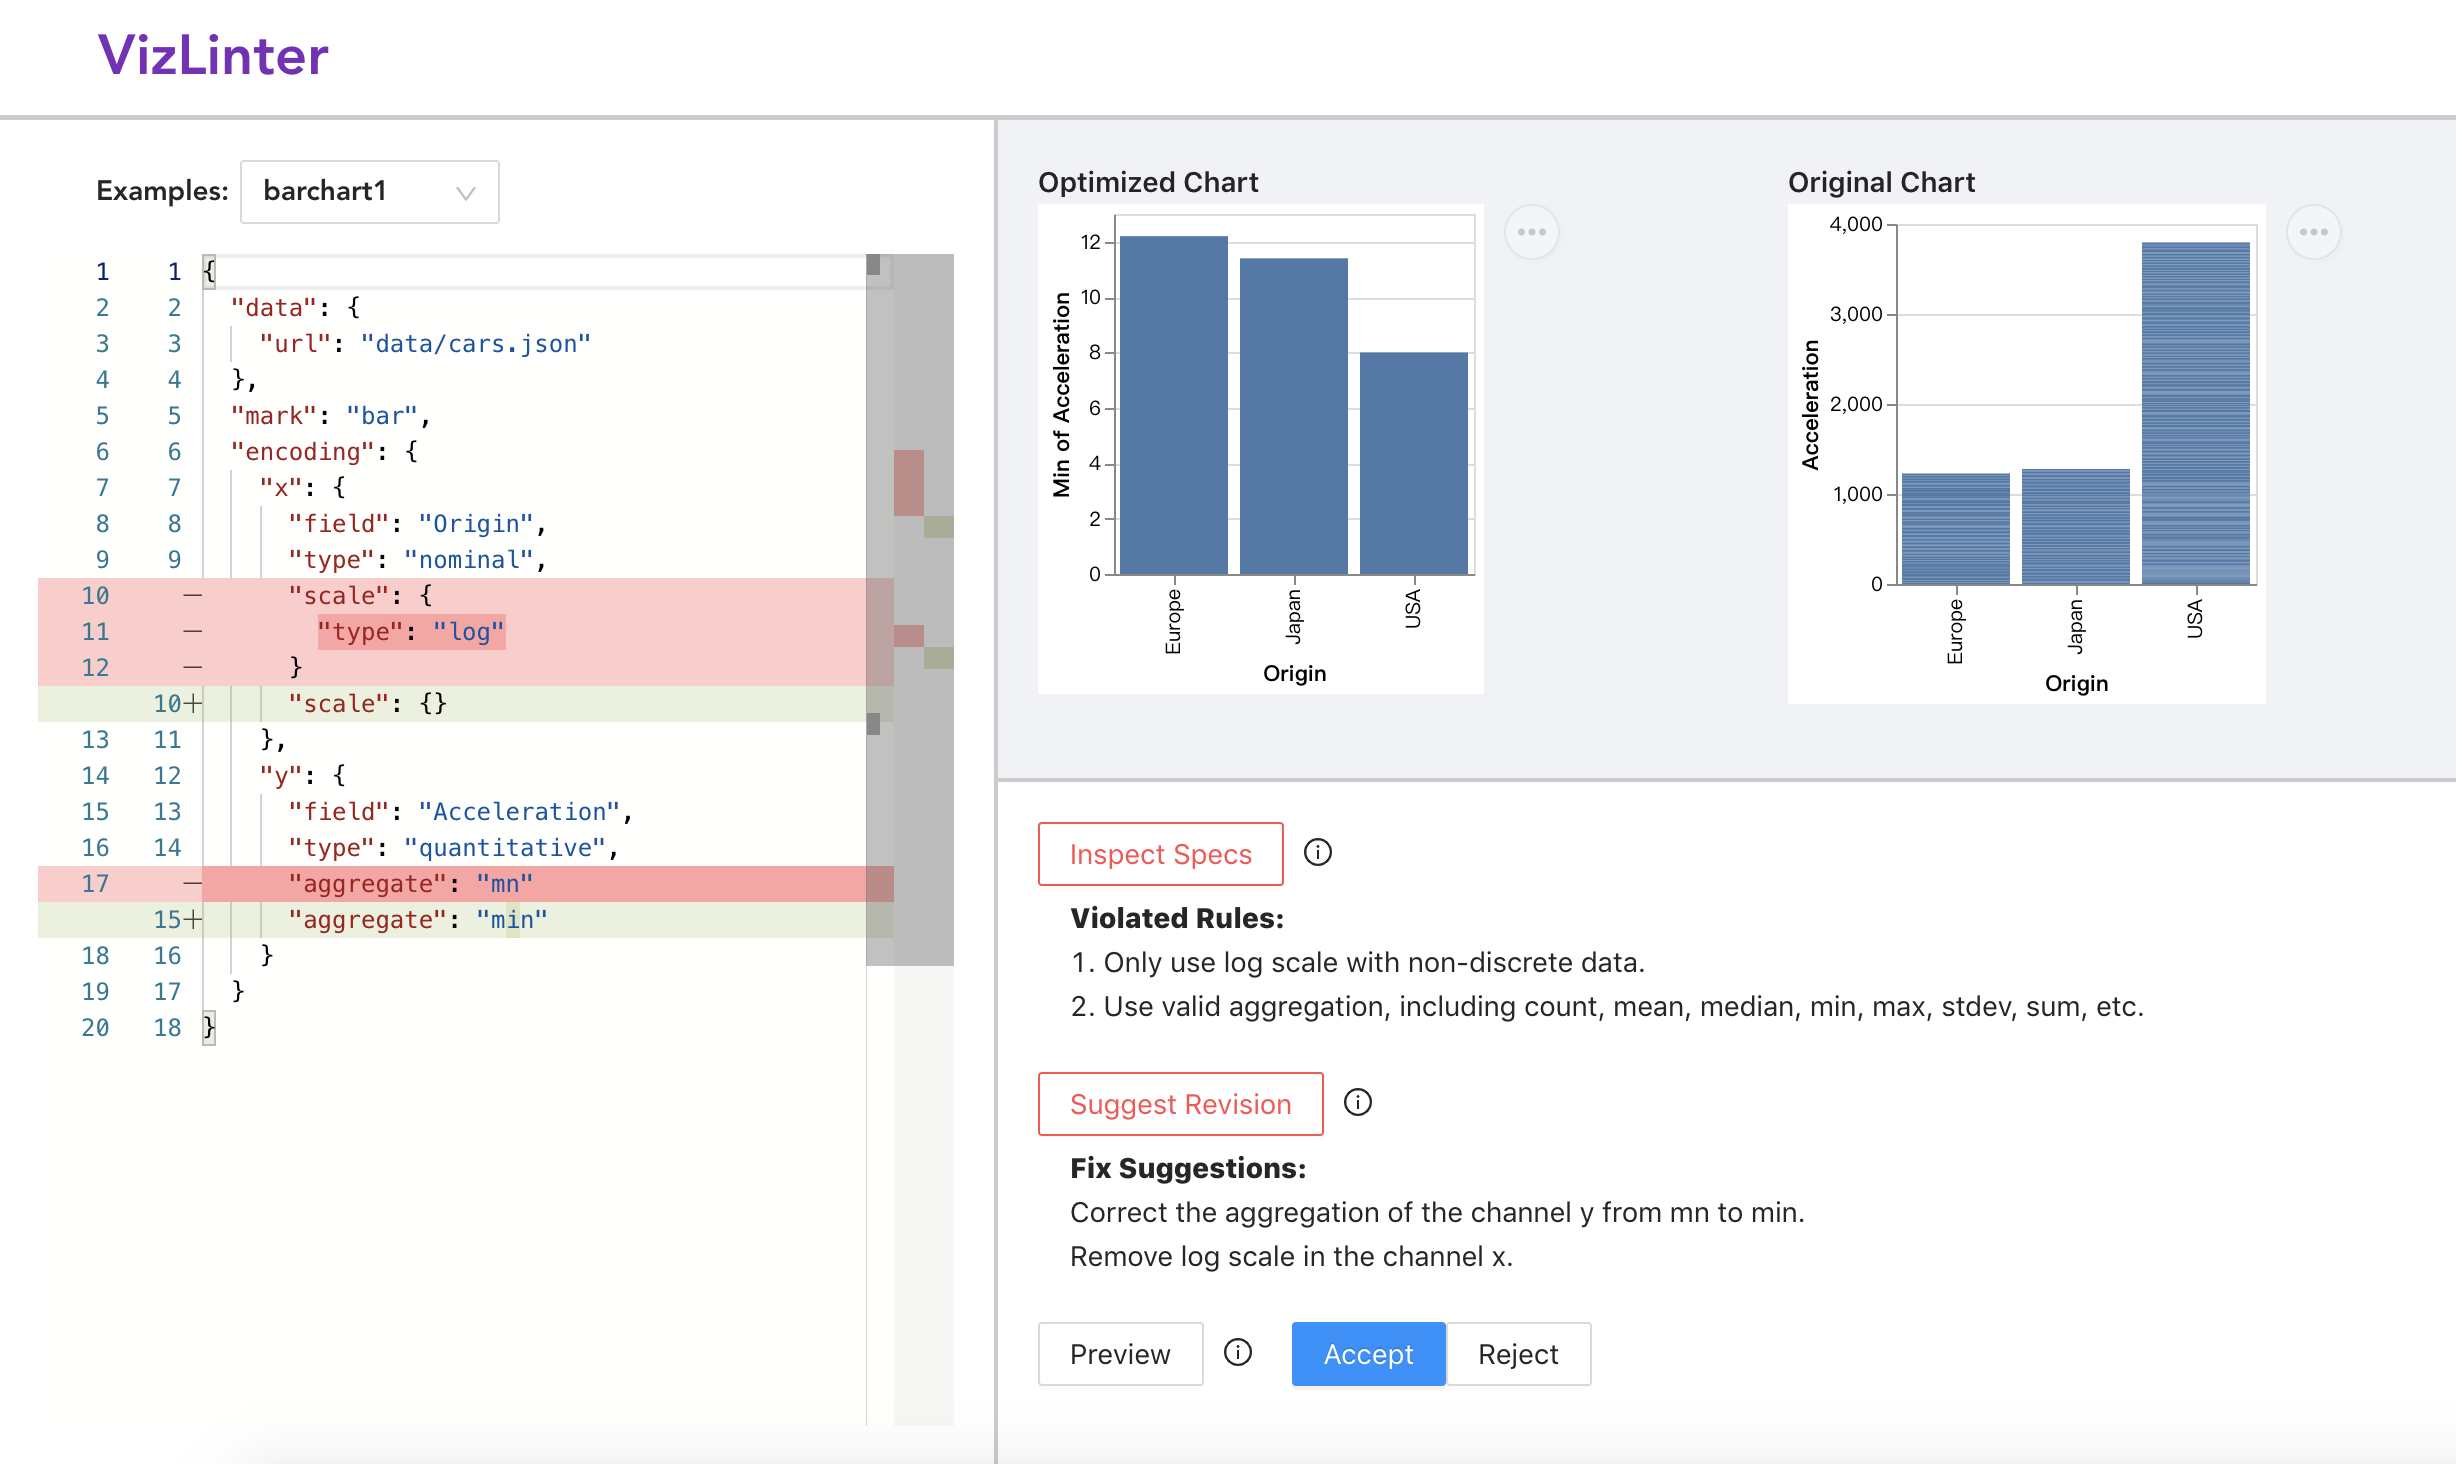
VizLinter: Online Vega-Lite Editor
An online Vega-Lite editor VizLinter is developed with the linting and fixing functions based on vega-lite-linter for Vega-Lite developers to build and validate visualizations. After writing or loading visualization specifications in the editor panel, users can click the "Inspect Specs" button to view any violated rules of the current visualization specification. Users can correct the specification according to the description of rules on their own or check our suggested actions by clicking the "Suggest Revision" button. To preview the automatic modifications done by VizLinter, users can click the "Preview" button. The corresponding revised specification will be shown in the code panel and users can decide whether to apply or to reject the revisions via the "Accept" and "Reject" buttons.
Examples
Example 1
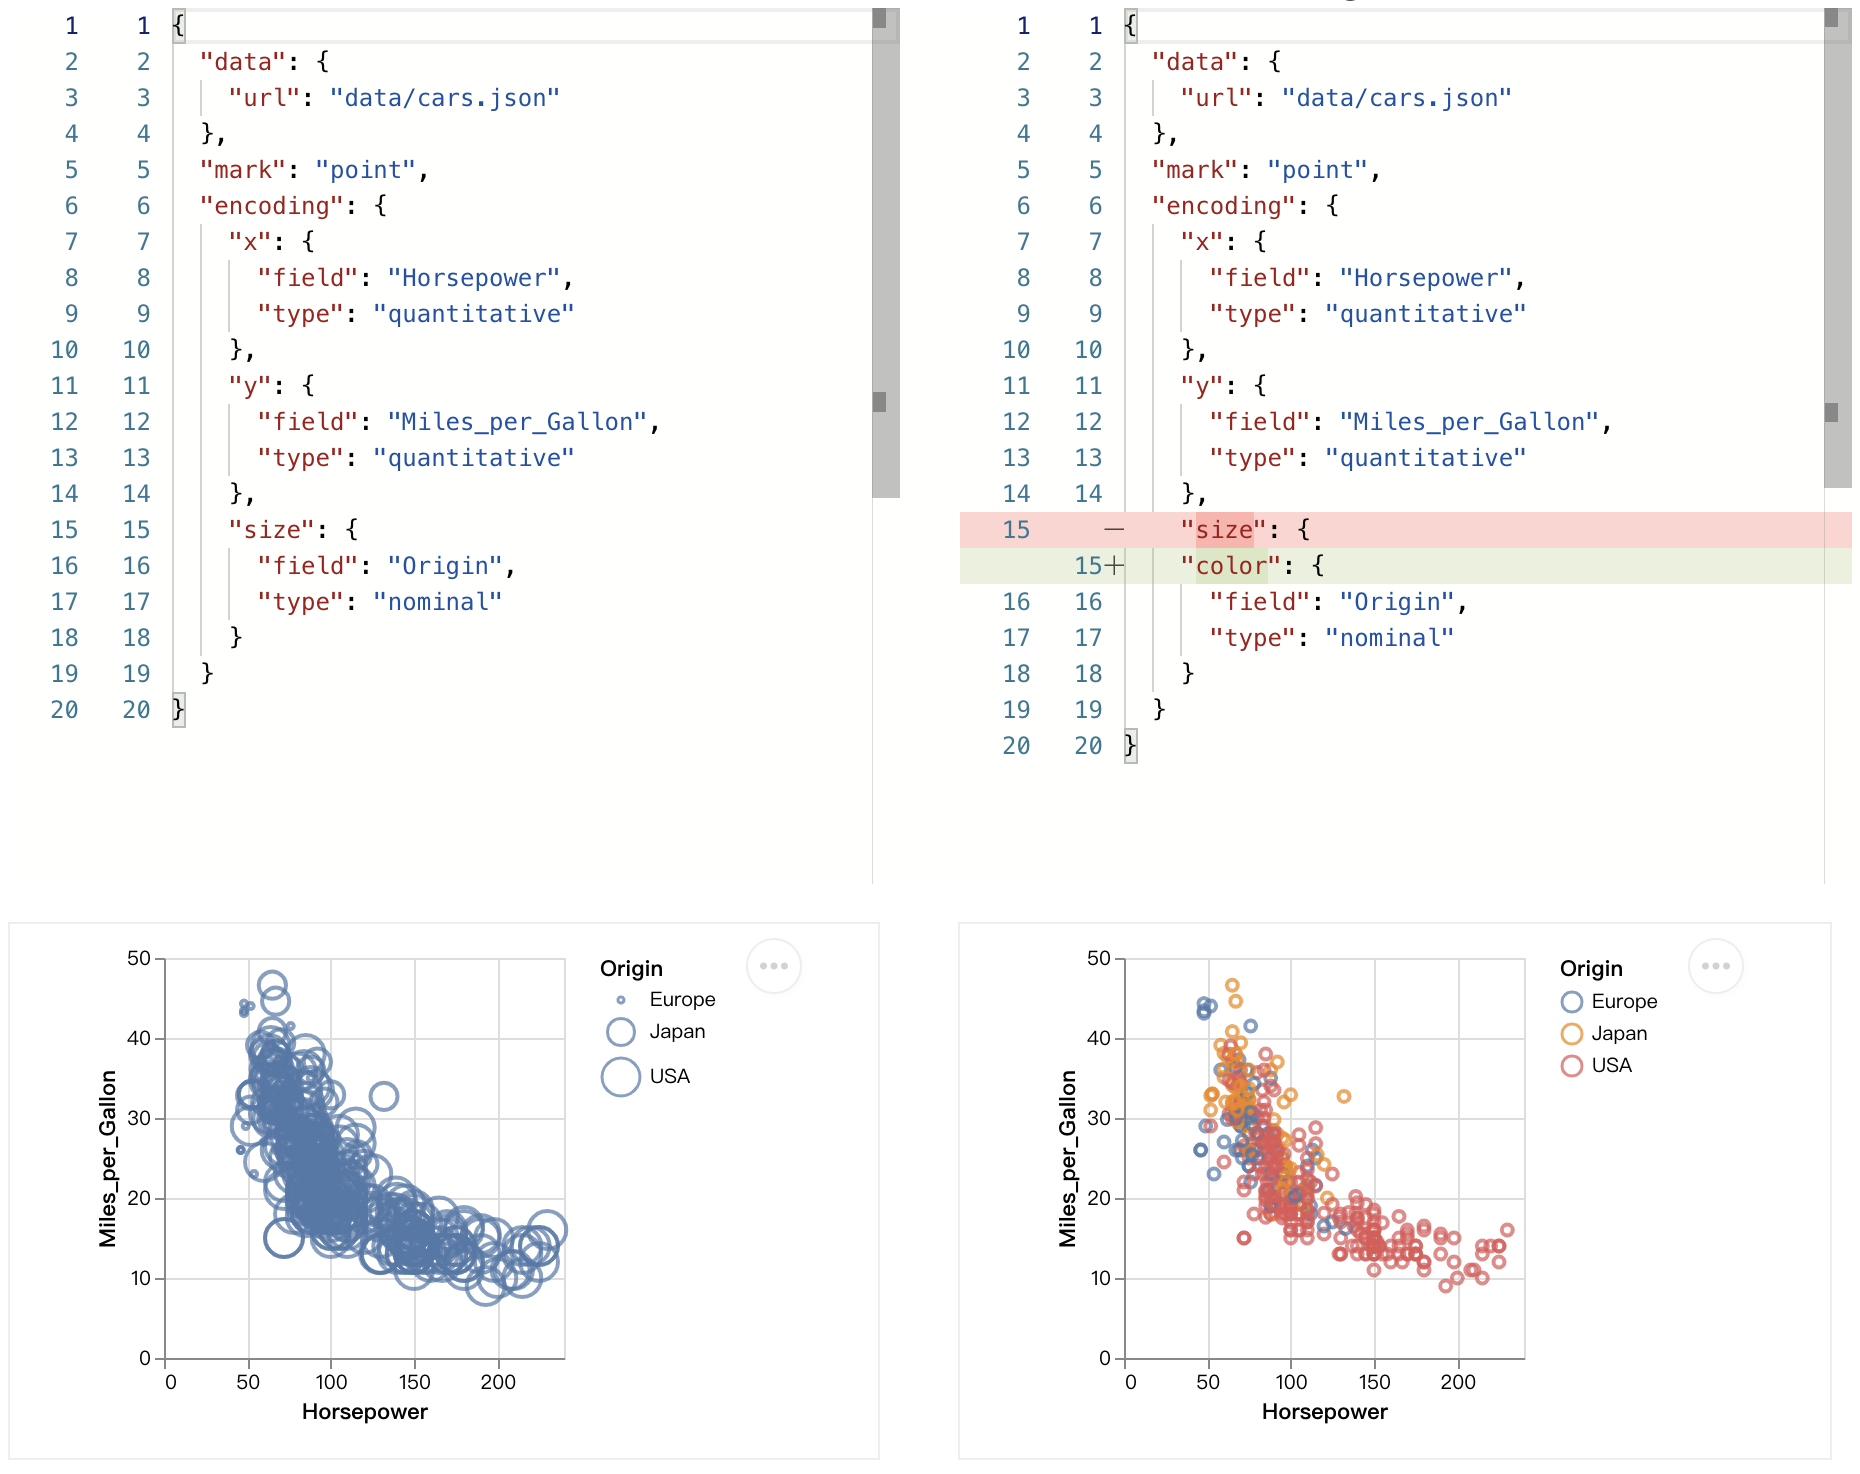
In this case, the original visualization(left) violates one rule:
- Channel
sizeimplies order in the data, it is not suitable for nominal data.
It can be fixed by changing the channel size to color.
from vega_lite_linter import Lint

vega_json = {
    "data": {
        "url": "data/cars.json"
    },
    "mark": "point",
    "encoding": {
        "x": {
            "field": "Horsepower",
            "type": "quantitative"
        },
        "y": {
            "field": "Acceleration",
            "type": "quantitative"
        },
        "size": {
            "field": "Origin",
            "type": "nominal"
        }
    }
}

# initialize
lint = Lint(vega_json)

# show rules that the input vega-lite json violated
violate_rules = lint.lint()

# show fixing recommendation by vega-lite-linter
fix = lint.fix()

print(fix['optimize_spec'])
Example 2
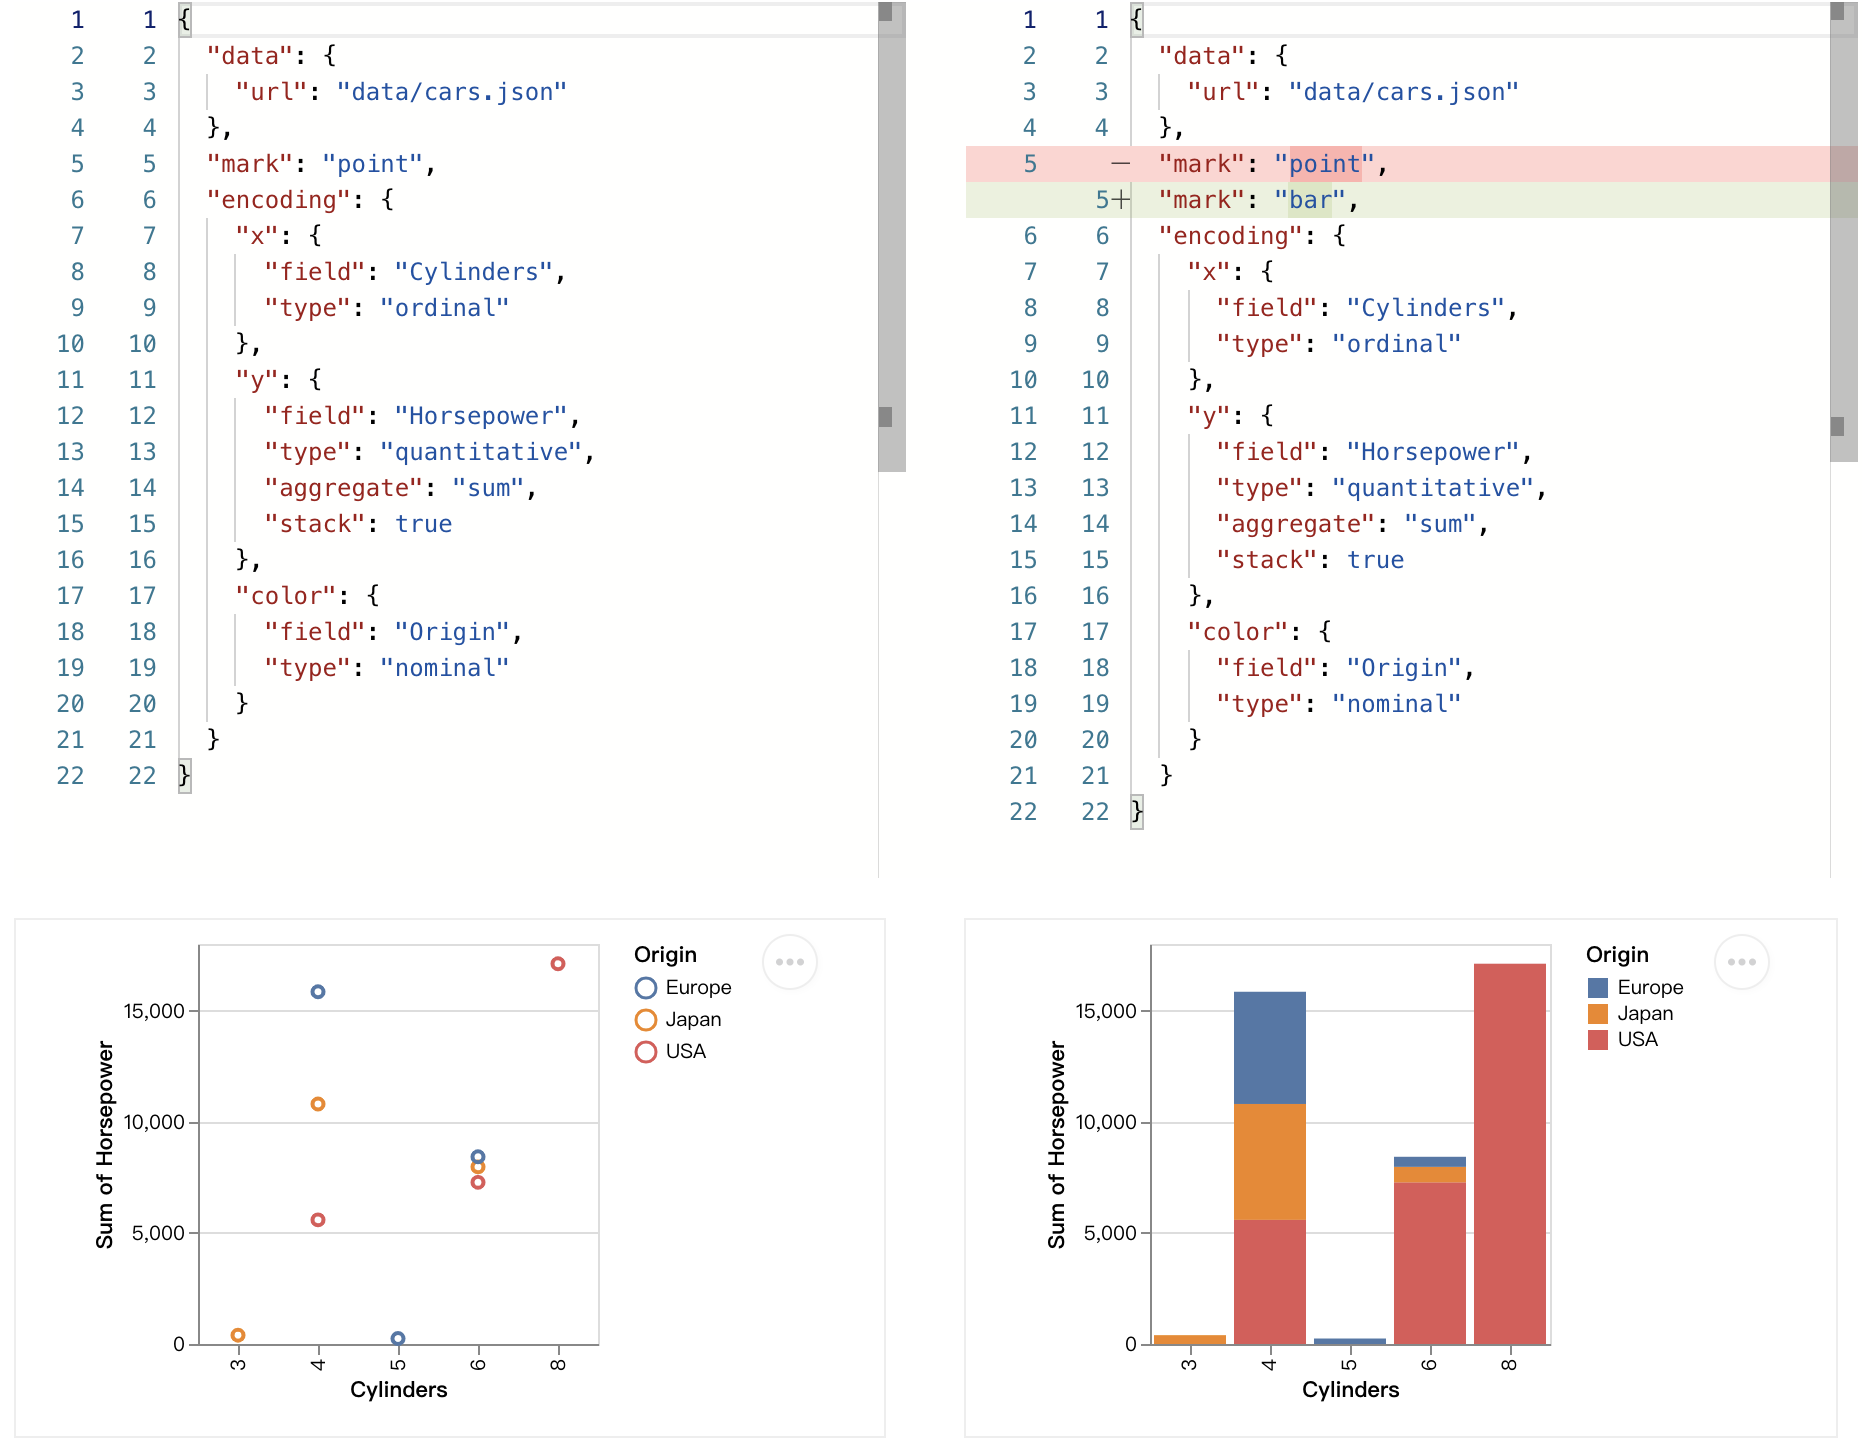
In this case, the original visualization(left) violates one rule:
- Only use stacking for mark
barandarea.
It can be fixed by changing the mark type from point to bar.
from vega_lite_linter import Lint

from vega_lite_linter import Lint

vega_json = {
    "data": {
        "url": "data/cars.json"
    },
    "mark": "point",
    "encoding": {
        "x": {
            "field": "Cylinders",
            "type": "ordinal"
        },
        "y": {
            "field": "Horsepower",
            "type": "quantitative",
            "aggregate": "sum",
            "stack": True
        },
        "color": {
            "field": "Origin",
            "type": "nominal"
        }
    }
}

# initialize
lint = Lint(vega_json)

# show rules that the input vega-lite json violated
violate_rules = lint.lint()

# show fixing recommendation by vega-lite-linter
fix = lint.fix()

print(fix['optimize_spec'])
Example 3
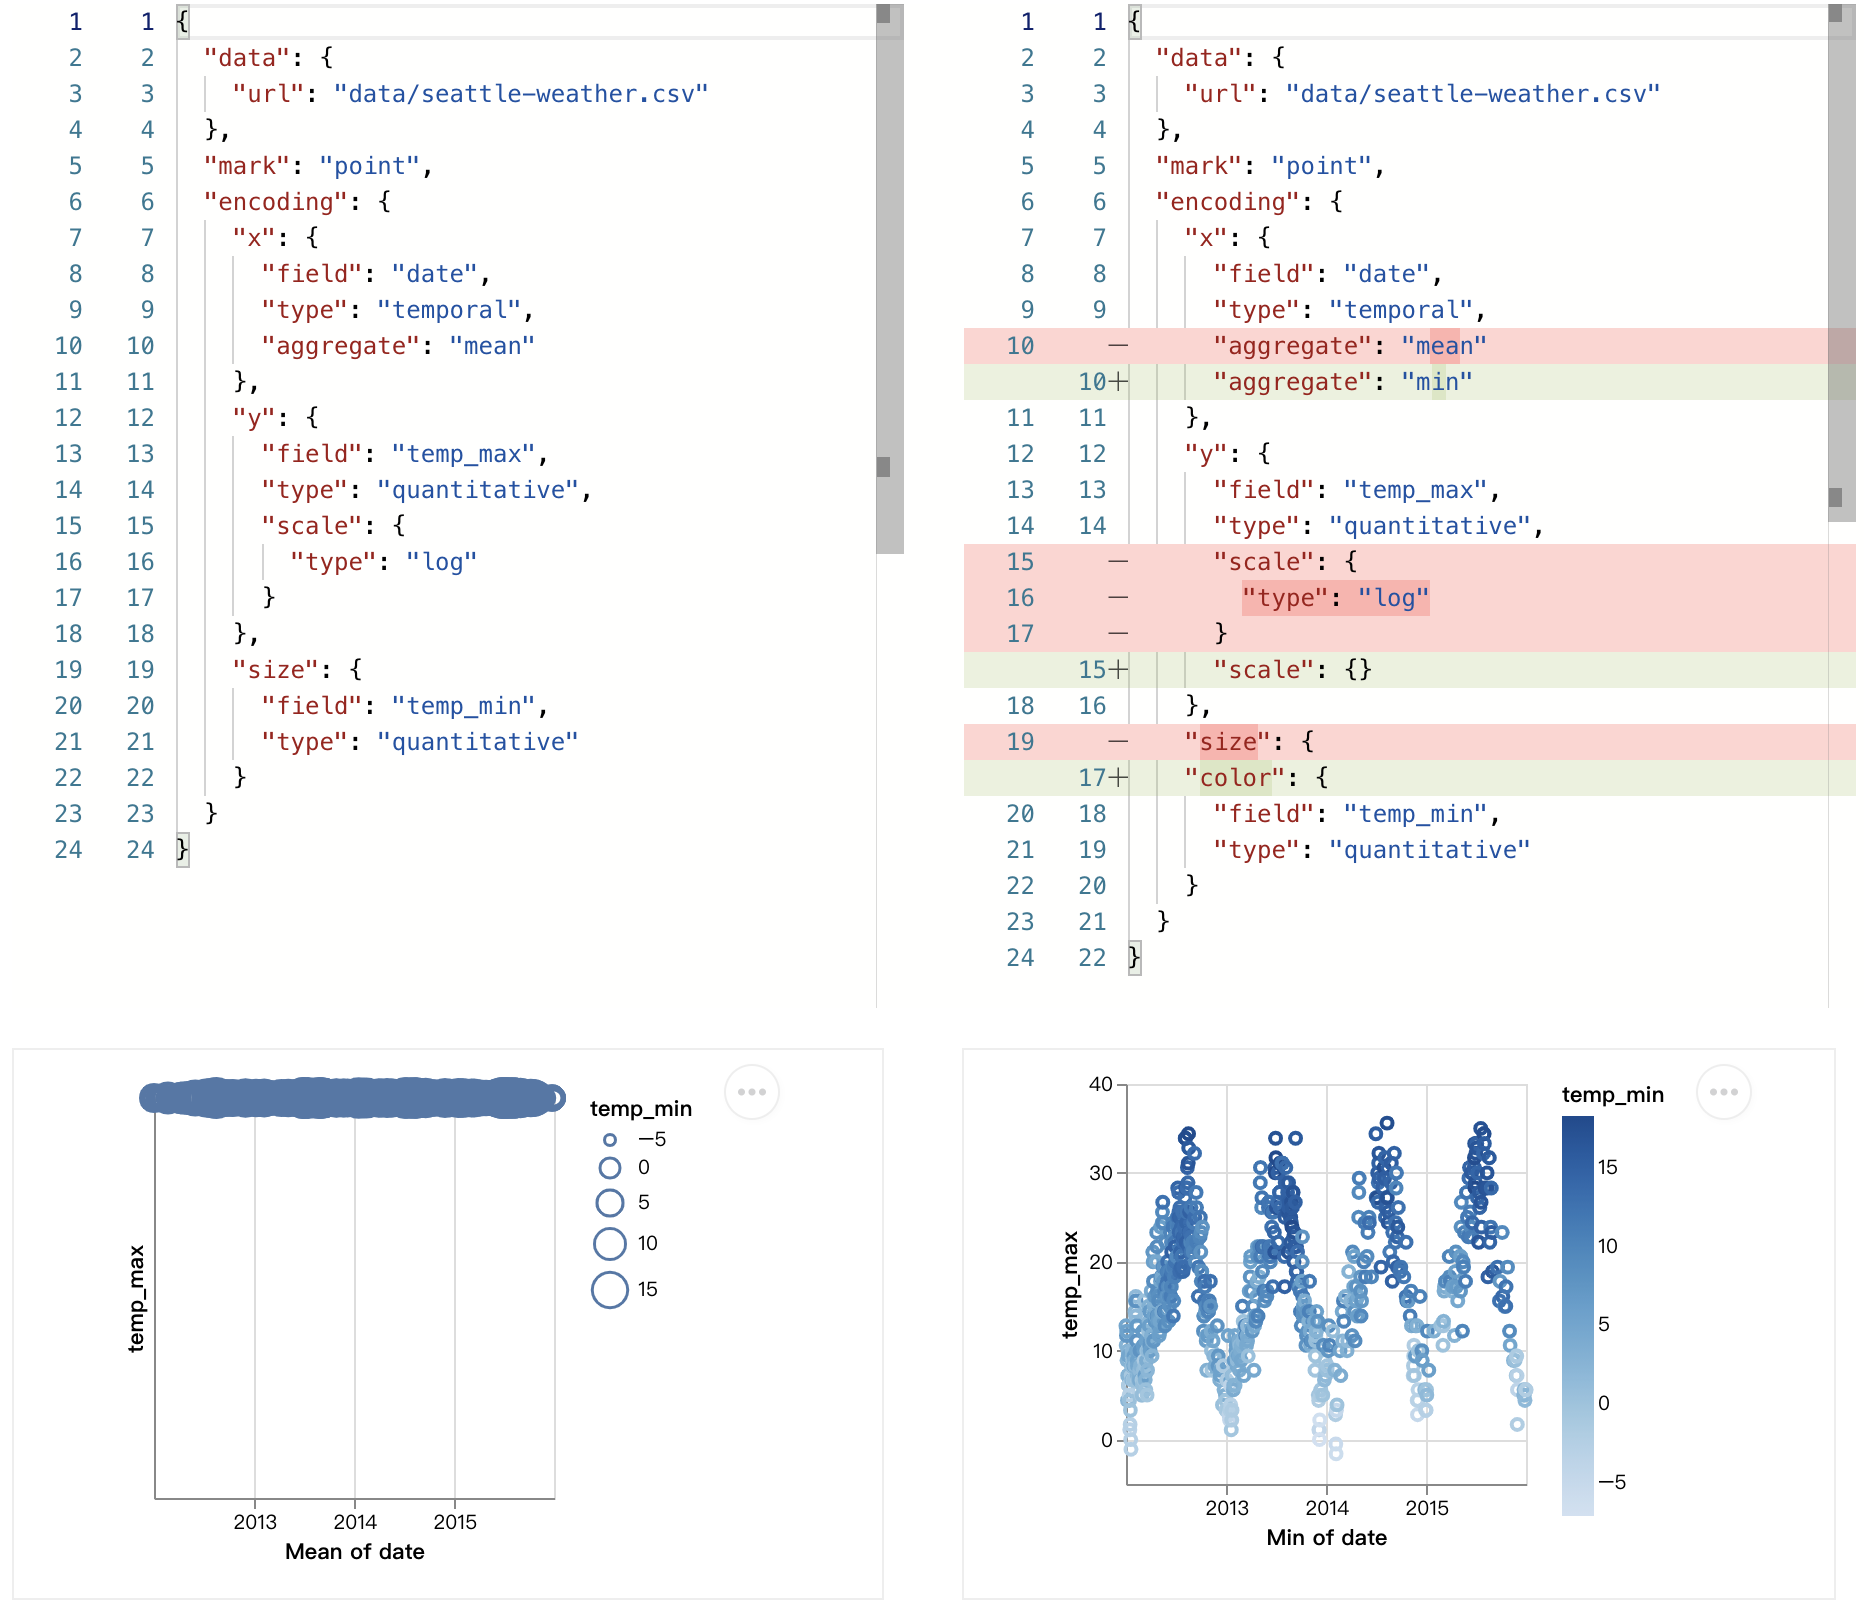
In this case, the original visualization(left) violates three rule:
- Channel
sizeis not suitable for data with negative values. - Only use
logscale on data that are all positive. - Temporal data only supports min and max aggregation.
It can be fixed by actions:
- Removing
logscale in the channely. - Using min aggregation for the data in the channel
xinstead. - Changing channel
sizetocolor.
from vega_lite_linter import Lint

vega_json = {
    "data": {
        "url": "data/seattle-weather.csv"
    },
    "mark": "point",
    "encoding": {
        "x": {
            "field": "date",
            "type": "temporal",
            "aggregate": "mean"
        },
        "y": {
            "field": "temp_max",
            "type": "quantitative",
            "scale": {
                "type": "log"
            }
        },
        "size": {
            "field": "temp_min",
            "type": "quantitative"
        }
    }
}

# initialize
lint = Lint(vega_json)

# show rules that the input vega-lite json violated
violate_rules = lint.lint()

# show fixing recommendation by vega-lite-linter
fix = lint.fix()

print(fix['optimize_spec'])
Example 4
In this case, the original visualization(left) violates three rules:
- Use count aggregation once in the visualization.
- Use count aggregation or declare a data field of an encoding, instead of doing both of them.
- Nominal data cannot be aggregated.
It can be fixed by removing the aggregation in the channel x.

from vega_lite_linter import Lint

vega_json = {
    "data": {
        "url": "data/seattle-weather.csv"
    },
    "mark": "bar",
    "encoding": {
        "x": {
            "field": "weather",
            "type": "nominal",
            "aggregate": "count"
        },
        "y": {
            "type": "quantitative",
            "aggregate": "count"
        }
    }
}

# initialize
lint = Lint(vega_json)

# show rules that the input vega-lite json violated
violate_rules = lint.lint()

# show fixing recommendation by vega-lite-linter
fix = lint.fix()

print(fix['optimize_spec'])